![]()
You are here
A New Map for Gardeners: Just How Accurate Is It?
A New Map for Gardeners: Just How Accurate Is It?
By Thomas Christopher
On Nov. 15, the United States Department of Agriculture (USDA) published an update of a standard gardening tool, its “Plant Hardiness Zone Map.” You probably missed this news, but it’s likely to affect the selection of plants offered at your local garden center, and perhaps the plants you will choose to purchase there.
Why is this? Because this map is the most popular guide about whether a particular type of plant will or won’t survive in your garden. You’ll find the USDA map in most gardening books and referred to on most plant labels at your local garden center, and in plant descriptions in nursery catalogs.
The changes you’ll find when comparing the new edition of the map to its predecessor, the 2012 edition, are interesting. They provide, for instance, unmistakable evidence that the climate throughout most of the United States is changing.
Personally, I do not think the changes made by the USDA in the present map go far enough, that they don’t accurately reflect the accelerating speed with which the climate is changing in most regions of the country. What’s more, because of the map’s premise that the degree of winter cold is the primary challenge to a plant’s survivability, the Plant Hardiness Zone Map does not reflect at all many of the other stresses that our increasingly erratic weather is having on plant survival from year to year.
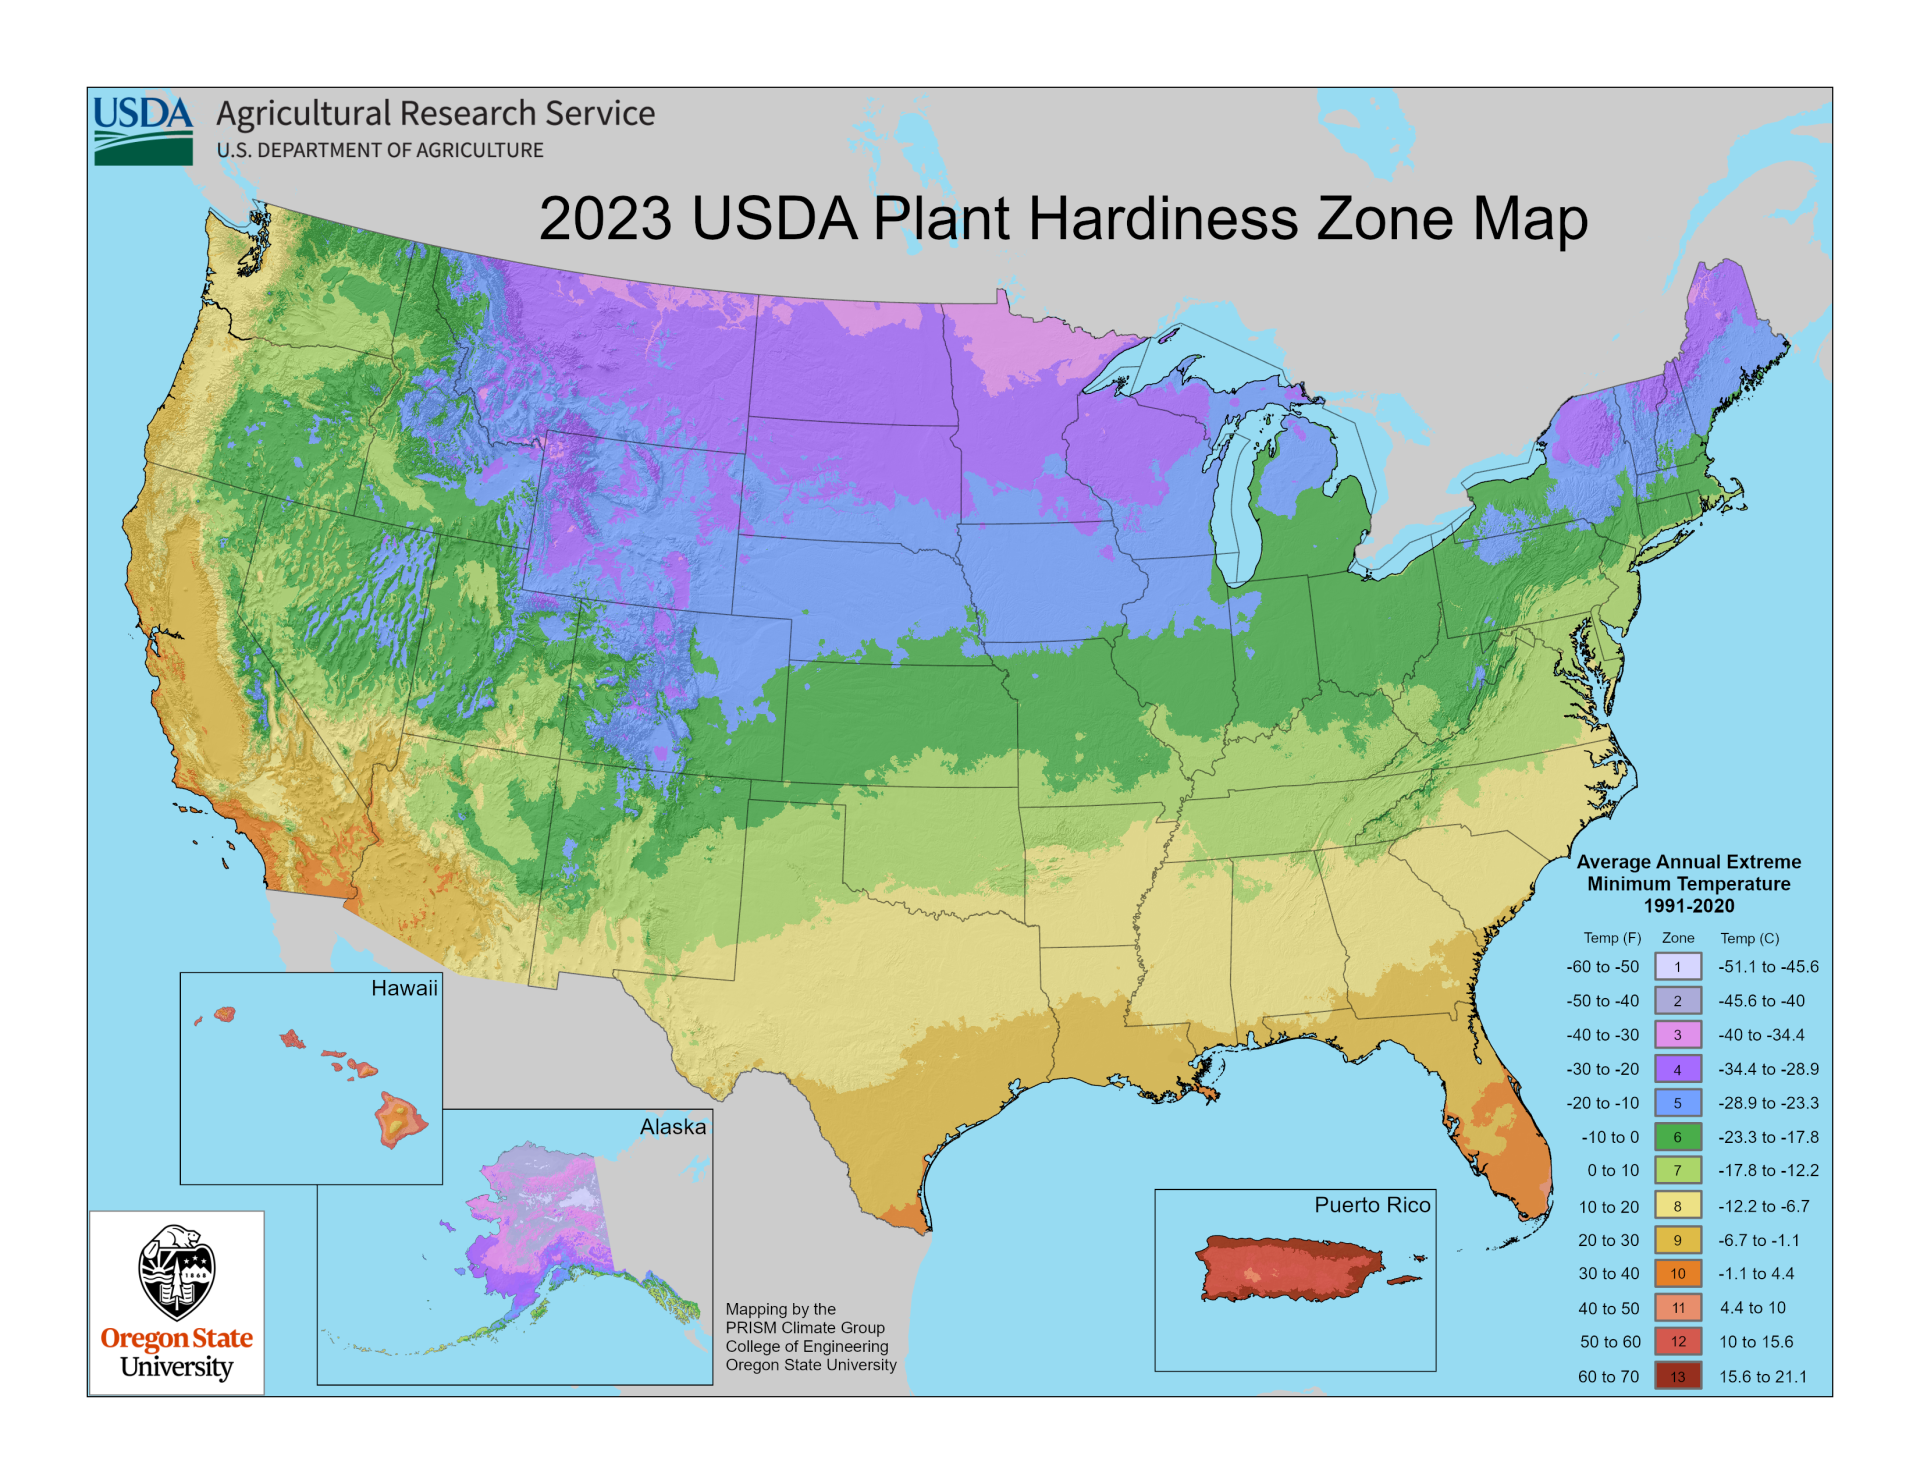
The emphasis on winter cold marks the influence of the map’s birthplace. The first hardiness zone map was developed in the 1920s at the Arnold Arboretum in Boston, a place where winter cold was, arguably, the most serious threat to plant survival from year to year. The USDA chose to follow this example when it began publishing its own versions of a plant hardiness zone map in 1960 and has maintained this as the principal criterion of plant survivability ever since.
The problem with this blinkered view is that many other factors also determine whether a perennial plant, tree or shrub is going to survive from one year to the next. In the southeastern states, summer heat and humidity often pose a bigger challenge to plant health, and in the western ones, seasonal drought is often the critical factor. Even in the Northeast, other factors besides winter lows are important and, I believe, becoming more so as our weather becomes more unpredictable.
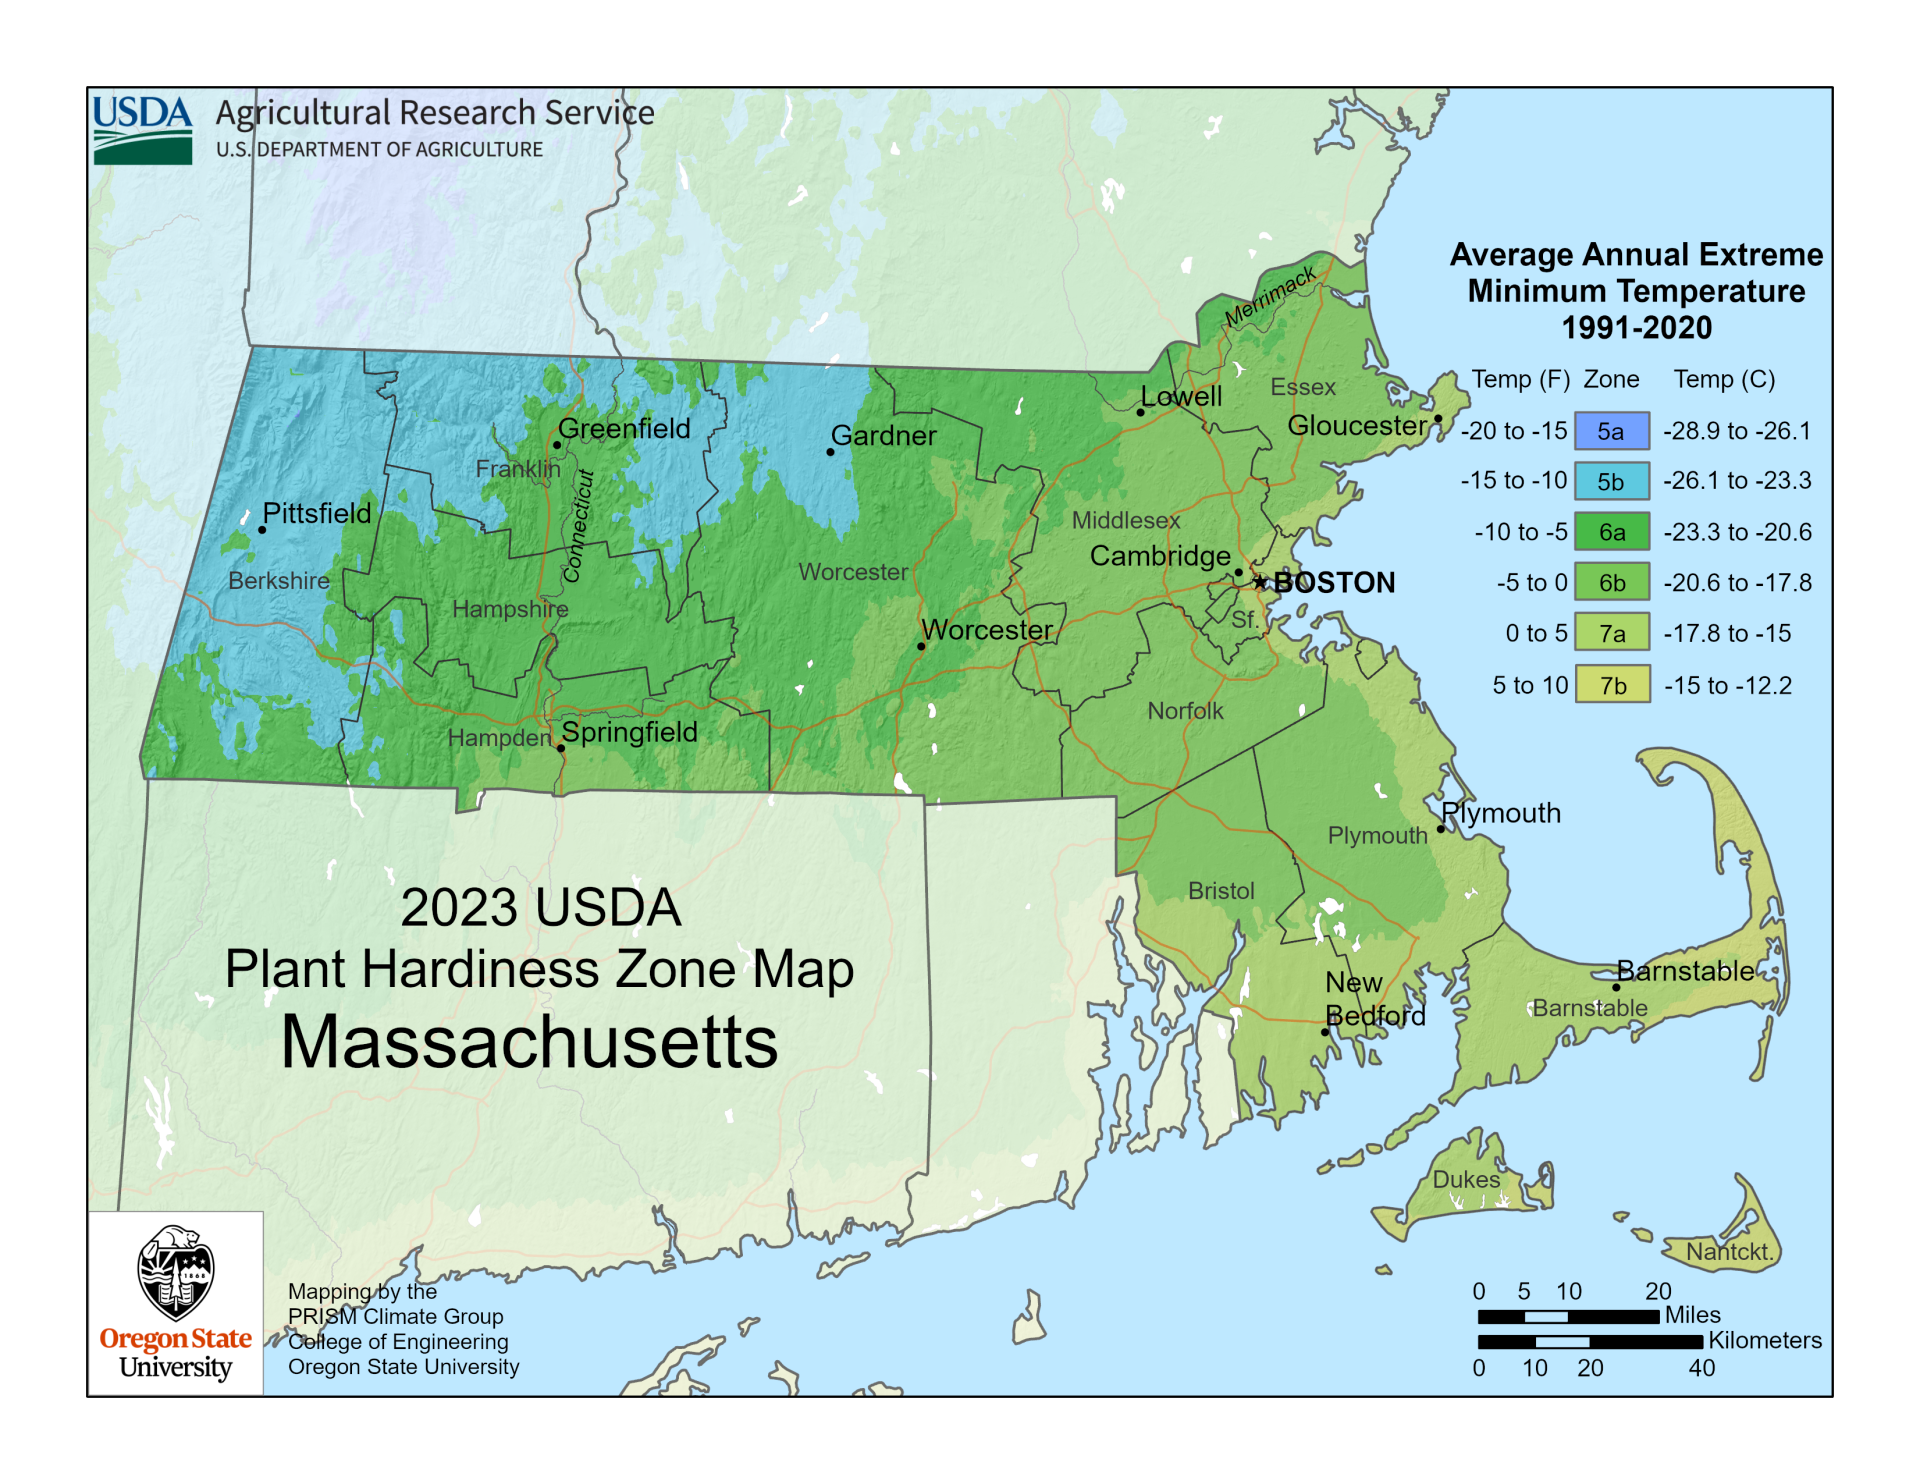
The current USDA map divides the geographical area it covers into zones based on 10 degrees Fahrenheit changes in the winter lows, further dividing each zone into two sub-zones, “A” and “B.” My region of southwestern Massachusetts, for example, has been assigned to zone 6a, an area where the average winter low is supposed to be between -10 degrees Fahrenheit and -5 degrees Fahrenheit. In the previous edition of the map, published in 2012, my garden was included in zone 5b, where the winter lows are supposed to be between -15 F and -10 F.
I believe the new map is already out of date because, to minimize the impact of freak weather events on the average low, the USDA chose to average together 30 years of weather records (1991-2020). This means that the winter temperatures of 1991, when New England was significantly colder, is given as much weight as those of winter 2022-2023, which was tied with 2015-2016 for the warmest winter on record in Massachusetts.
Paradoxically, warmer winters, which typically produce less snowfall, can prove more challenging for cold sensitive plants. When I was a student at the New York Botanical Garden almost 50 years ago, I spent winter days shoveling snow onto the beds because snow provides very effective insulation, protecting dormant perennials from temporary plunges in air temperature, as well as from brief thaws that may lure perennials out of dormancy prematurely. Today’s lack of consistent winter snow cover in southern and central New England and other parts of the Northeast means that dormant plants commonly lack this protection. A lack of snow also exposes perennials to dehydrating winter winds.
Other threats to plant survival that are currently increasing in our region, and which are ignored by the USDA hardiness map, include less reliable precipitation, as our weather is tending to veer from drought to flood, and greater summer heat which increases plants’ need for moisture.
Where does that leave the gardener? We must rely to a greater extent on personal experience when it comes to plant choices. Read the map, in other words, but with a grain of salt.
Be-a-Better-Gardener is a community service of Berkshire Botanical Garden, located in Stockbridge, Mass. Its mission, to provide knowledge of gardening and the environment through a diverse range of classes and programs, informs and inspires thousands of students and visitors each year. Thomas Christopher is a volunteer at Berkshire Botanical Garden and is the author or co-author of more than a dozen books, including Nature into Art and The Gardens of Wave Hill (Timber Press, 2019). He is the 2021 Garden Club of America's National Medalist for Literature, a distinction reserved to recognize those who have left a profound and lasting impact on issues that are most important to the GCA. Christopher’s companion broadcast to this column, Growing Greener, streams on WESUFM.org, Pacifica Radio and NPR and is available at berkshirebotanical.org/growinggreener.
Help Our Garden Grow!
Your donation helps us to educate and inspire visitors of all ages on the art and science of gardening and the preservation of our environment.
All donations are 100 percent tax deductible.